The data for this quarter is quite similar to the previous one, as the Federal Reserve’s interest rate hikes are nearing their end, and New York City continues to maintain a buyer’s market atmosphere. Therefore, most of the data aligns closely with my previous quarter’s predictions, but there have been some interesting developments in the Condo and luxury home markets. Condo transaction volumes have increased between 11-14% this quarter, while there seems to be a possibility of luxury homes hitting bottom.
The data is sourced from the two largest companies in Manhattan’s real estate market, DE & Miller and Corcoran. Below, I have summarized some important data and provided my own insights for your reference:
Personal Observations and Predictions
The impact of the interest rate hikes on housing prices is indeed significant, especially for new homes, which often experience sales pressures and drive prices to new highs.
In contrast, many existing homeowners locked in fixed-rate mortgages at low interest rates for 30 years. As a result, the supply of existing homes is limited, and there is relatively little room for price negotiations.
This phenomenon is particularly evident in the affordable housing market, where the potential for price declines is not very substantial.
Under the pressure of high rents, many people are caught between the dilemma of buying or renting, hoping for acceptable prices, temporarily accepting higher interest rates, and planning to refinance when interest rates drop.
I believe the buyer’s market for affordable and mid-priced homes will continue until after the third quarter, primarily depending on economic conditions.
The luxury home market in Manhattan is experiencing significant fluctuations. From our observations, developers are willing to offer substantial discounts on high-priced new luxury homes, including properties like Central Park Tower, 111 W 57th Street, and others. Since high-end properties are closely tied to global market trends and the economy, this might present an opportunity for buyers who have been observing the New York luxury home market.
For investment-oriented buyers, the best to worst scenarios are as follows:
- Buying during low housing prices and low-interest rates, around 2020Q2.
- Buying during low housing prices and high-interest rates, possibly between now and 2024Q1.
- Buying during high housing prices and low-interest rates, around 2021Q4 and 2022Q1.
- Buying during high housing prices and high-interest rates, around 2022Q3.
DE & Miller Report
Manhattan Comprehensive Market Report
Transaction Volume
- Yearly Change: -39.4%
- Quarterly Change: +3.7%
Median Sale Price
- Yearly Change: -4.0%
- Quarterly Change: +11.6%
Median Sale Price for New Homes
- Yearly Change: -23.1%
- Quarterly Change: +25%
Median Sale Price for Existing Homes
- Yearly Change: -3.8%
- Quarterly Change: +9.5%
Inventory
- Yearly Change: -3.1%
- Quarterly Change: +10.3%
According to the Miller report, some key factors to consider are:
Compared to last year’s hot market, the data for this quarter remains relatively bleak, with the median sale price declining for three consecutive quarters, and inventory still lower than the same period last year. Cash buyers accounted for two-thirds (65%) of transactions.
Manhattan Condo Report
Next, let’s focus on an essential property type, Condos:
Manhattan Condo Data
Transaction Volume
- Yearly Change: -38.3%
- Quarterly Change: +11.3%
Median Sale Price
- Yearly Change: -11.0%
- Quarterly Change: +1.9%
Average Price per Square Foot
- Yearly Change: -5.0%
- Quarterly Change: -4.4%
Inventory
- Yearly Change: -4.4%
- Quarterly Change: +7.2%
Percentage of Condo Sales & Median Sale Price
- Studio: 10%, $652,000
- 1-bedroom: 33.9%, $1,095,000
- 2-bedroom: 31.9%, $2,060,000
- 3-bedroom: 16.5%, $4,312,000
- 4-bedroom: 7.6%, $8,550,000
As observed by Miller:
- The decline in the average price of new condos has brought down the overall figures.
- Inventory experienced its first annual decline in the past five quarters, indicating reduced seller willingness to list properties.
- Transaction volume has seen a substantial year-on-year decline for four consecutive quarters.
Manhattan Luxury Market
The high-end market in Manhattan is intriguing, as price declines have been steeper and more significant than other property segments. Looking at the price trends for 2023Q1 and 2023Q2, we can see the median sale price is rebounding, transaction volumes have slightly increased, but unit prices continue to decline. This phenomenon could be explained by high-end buyers entering the market and purchasing larger properties at lower unit prices but higher total prices.
Manhattan Luxury Market Data
Transaction Volume
- Yearly Change: -39.6%
- Quarterly Change: +3.6%
Median Sale Price
- Yearly Change: +3.9%
- Quarterly Change: +18.7%
Average Price per Square Foot
- Yearly Change: -1.9%
- Quarterly Change: -3.6%
Inventory
- Yearly Change: -8.4%
- Quarterly Change: -12.9%
Percentage of Luxury Home Sales & Median Sale Price
- New Homes: 28.8%, $6,500,000
- Existing Homes: 71.2%, $6,625,000
As per Miller’s observations:
- The median sale price has increased for the fifth time in six quarters.
- Inventory declined for the first time in the past 12 months.
- The percentage of bidding or competitive purchases is at its third-highest level in history.
I’ve prepared DE/Miller’s luxury home price chart for these two quarters, showcasing the trends in median sale prices and transaction volumes. If we had access to the trend chart for unit prices in the luxury home market, it would likely show a significant decline.
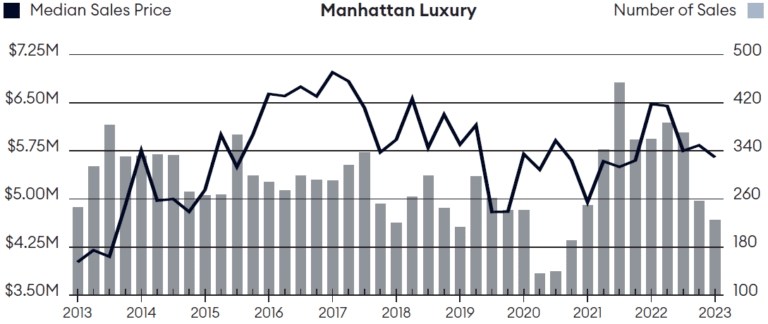
2023Q1 Luxury Market
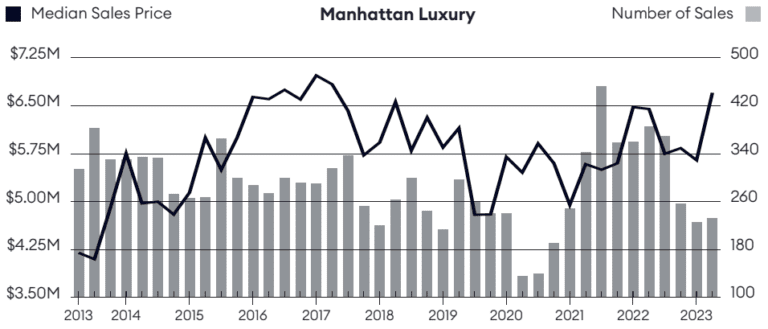
2023Q2 Luxury Market
Manhattan New Home Market
The Manhattan new home market has undergone significant changes, with a stark contrast between buyer preferences for new homes and the luxury home market. New home developers are now focusing on smaller properties, targeting the overall price market. On the other hand, some luxury home buyers are taking advantage of this opportunity to purchase larger properties.
This quarter, the market share of new home transactions is the smallest in the past four years. The size of homes being sold is also the smallest since 2008. Additionally, the median sale price for new homes has been lower than the same period last year for two consecutive quarters.
The cooling of the housing market has been particularly noticeable for the new home market and developers, who have been instrumental in driving up property prices. However, this quarter marks the beginning of some signs of improvement.
Key Data for Manhattan New Home Market:
Transaction Volume
- Yearly Change: -38.3%
- Quarterly Change: +11.3%
Median Sale Price
- Yearly Change: -11.0%
- Quarterly Change: +1.9%
Average Listing Price
- Yearly Change: -9.9%
- Quarterly Change: -5.1%
Average Price per Square Foot
- Yearly Change: +1.8%
- Quarterly Change: -3.5%
Inventory
- Yearly Change: -7.7%
- Quarterly Change: -3.4%
In terms of market share, properties below $1 million account for a similar percentage to properties above $3 million. This is primarily due to the limited availability of new homes priced below $1 million in Manhattan, as they are scarce, except in less popular areas.
Here are the price ranges, market shares, and changes in transaction volumes:
Below $1 million
- Market Share: 24.4%
- Yearly Change: -50.5%
$1 million to $3 million
- Market Share: 46.8%
- Yearly Change: -64.1%
Above $3 million
- Market Share: 28.9%
- Yearly Change: -68.8%
Corcoran Data and Report
The second quarter of 2023 brought about a rebalancing in the Manhattan real estate market.
“With a 48% increase in transaction volume between quarters, the second quarter of 2023 indicates a market that is trending towards stability. Unless there is a significant influx of new housing inventory, we may not see further price declines. Potential buyers should seriously consider their current options, or they may miss out on an excellent opportunity to purchase property in Manhattan.” – Pamela Liebman, President, and CEO of Corcoran.
Signs of the market gradually normalizing emerged in the second quarter of 2023.
Typical springtime listing activity increased, the pace of interest rate hikes slowed down, and some price flexibility encouraged interested buyers to re-enter the market. During this quarter, buyers encountered more flexible sellers and less competition. At the same time, they locked in prices, and unless a substantial amount of new inventory enters the market, there might not be much room for further price declines.
The overall market’s transaction volume increased by 48% between quarters, but it decreased by 23% compared to the record set in the second quarter of 2022.
Despite the yearly decline, the market is finding its footing and gradually entering the second-quarter sales pace closer to the long-term average. The second quarter of 2023 recorded 3,516 transactions, and while the overall number of contracts signed decreased significantly compared to last year (-20%), the Manhattan market is showing signs of growth in this quarter. Regarding contracts, the year-over-year decline in April tightened to 9%, and this trend continued to narrow down in June.
Inventory reached 7,338 units in the second quarter of 2023, marking the highest point in two years, but the availability of properties in lower price ranges noticeably decreased.
Supply trends in this quarter further highlighted disparities, with a 7% decrease in choices for buyers looking for properties priced below $2 million and a 6% increase in choices for buyers seeking homes priced above $2 million. This situation is also evident in the resale cooperative apartment market, where inventory has been tightening for eight consecutive quarters. Due to the increased sales share of homes priced below $2 million, the median price has declined for four consecutive quarters.
New development projects in the Financial District and Battery Park City have become influencing factors. Average prices and prices per square foot have only declined twice in the past two years.
Average prices declined due to a slowdown in sales activity for homes priced above $20 million on “Billionaire’s Row.”
Prices per square foot decreased by 2%, attributed to an increase in sales activity for value-oriented communities.
In the resale market, Co-op cooperative apartments’ prices remained stable compared to last year, while Condo ownership apartments saw a yearly decline, with the median price reaching the lowest point in two years.
The average prices also differed for the two property types, with resale cooperative apartment prices rising by 2% and resale condominium apartment prices decreasing by 3%, which is due to the increased sales share of one-bedroom units.
Conclusion
Overall, I believe that the property prices in New York City, particularly in the entry-level segment, will not experience drastic fluctuations. If someone is looking to buy a property for personal use or to hold for 5-6 years or more, I think the next 4-6 months might be a good time to enter the market.
From a local perspective, even though interest rates are high, the property prices are low, making it an opportunity for locals to consider refinancing in the future.
From the viewpoint of overseas buyers, although property prices are low, the high exchange rate of the US dollar means that unless they plan to hold the property for the medium to long term, they might face a decline in the value of the US dollar when interest rates decrease.
As for sellers, there has been a slight improvement in transaction volume, mainly because many buyers see the price adjustments and feel compelled to purchase due to the pressure of high rent and high-interest rates. If considering selling a property, it might be worth considering listing it in the golden time of September-October or around March next year.