2021Q3 marks the shift of buyer’s market to seller’s market.
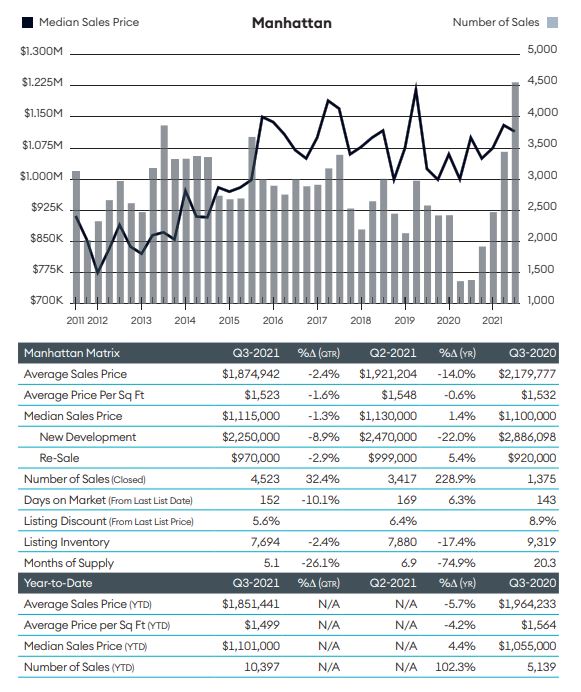
As we await for more information and data from other firms, here’s a glimpse of the data from Douglas Elliman.
Manhattan
+1.4% Increase in Median Sales Price
-15.2 months of supply (due to huge increase in number of sales)
+228.9% number of sales (number of sales tripled)
+ 9 days on market
-3.3% Negotiability
% of higher bidding increased
According to Corcoran
Demand skyrocketed during 3Q 2021, making this Manhattan’s best summer since 2007.
Closings increased on a quarterly and annual basis, reaching their highest level in 14 years — 4,989 closed sales reflect an incredible increase of 210% YOY and 19% quarter-over-quarter.
Still low interest rates, tightening supply and high confidence are powering Manhattan’s comeback, putting it on track to produce one of the best years ever for Manhattan real estate.
Contracts signed, the best barometer of current market conditions, remained incredibly strong, improving annually for the fourth consecutive quarter to over 3,500 deals.
At this pace, Manhattan is on track to break the 2007 record for the number contracts signed in a single calendar year.
This was a record summer for sales over $5M. In particular, the luxury market was driven by buyers seeking more space and better value in the condominium market.
More impressively, sales volume totaled over $9.5B, Manhattan’s highest quarterly total ever.
Sales volume this quarter hit a record high, surpassing the previous record of $8.54B set in 2Q 2019 by 12%.
Like contracts signed, 2021 could be a record year for sales volume, as well.
Average and median sale price increased year-over-year thanks to the shift in activity towards larger residences, but price per square foot figures rose only minimally, suggesting that pricing has stabilized or maybe even turned the corner.
Historically, pricing has started to rise nine to 12 months after sales activity improves; sales activity began to improve in September 2020.
Median price per square foot rose a lesser 4% to $1,319.
There is still a robust supply of for-sale inventory, but the sheer velocity of deal activity has driven the number of listings down significantly over the past year.
As of mid-September, 6,850 units were actively listed in Manhattan, down 28% year-over-year and the sharpest YOY drop in 15 years.
Excluding 2Q 2020, when listed inventory dipped while in-person showings were suspended, this was Manhattan’s first annual decline in listed inventory since 3Q 2015.
In concert with the drop in active listings, days on market also fell year-over-year for the first time since mid-2015, further underscoring the strength of the current Manhattan market.
As predicted in 2020Q2, number of sales and transaction volume both have increased, leading to a higher median asking price. This is something that we haven’t seen in more than 4 quarters. As shown in the DE graph below.

Simiarly, we see the same trend from Streeteasy charts up to August; indicating a rebound of the real estate market; coupled with already reported rebound in rent. From what I can see, the rebound is led by Manhattan. We have yet to observe huge price hikes in Queens and Brooklyn areas, but there’s no doubt that similar trend will ensue as Manhattan quickly shifts to seller’s market.

For those interested in purchasing a home, I would suggest to start searching and can still potentially find a good deal during this interim, especially during the December-January period. As inflation continues to run hot and New York City real estate continues to bounce back and price hikes continue, it will become harder for buyers to secure a home.
For sellers, the long wait is finally nearing an end as we see quick rise in median asking prices and less negotiability. Preparing the listing for sale becomes crucially important as the seller needs to make the apartment very presentable during the peaks of the year.
For landlords and renters, we can expect higher rent prices in the next 6-12 months as more students and office workers return to normalcy.
